Help & Documentation
  • Home
  • Sign In
  • Contact Us
  • Home
  • Sign In
  • Contact Us

Corn down to 376.8330

/Futures Technical Analysis - TD/Corn down to 376.8330

Corn down to 376.8330

Posted on February 3, 2020 by Autochartist wrote in Futures Technical Analysis - TD.

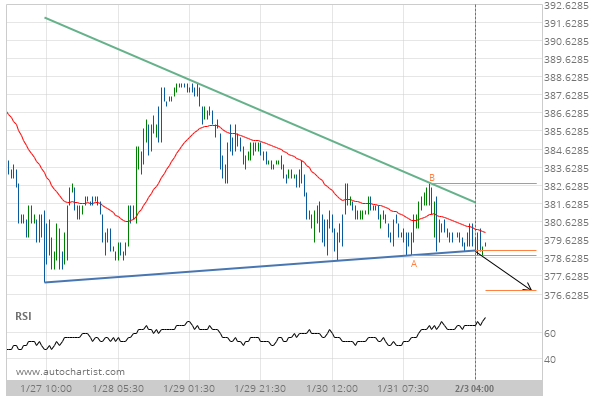
Triangle has broken through the support line at 03-Feb-2020 04:00 EST. Possible bearish price movement forecast for the next day towards 376.8330.

Tags: CBOT, ZC
0 Likes
617 Views

You may also like

Corn up to 364.7500
Corn up to 364.7500
April 29, 2019
Soybean Meal down to 298.5000
December 9, 2019
Feeder Cattle Front Month down to 141.0000
December 23, 2020

Comments are closed.

Multi-Day Mean Reversion 10 year T-Note up to 131.9063

Futures Technical Analysis – TD

Light Sweet Crude Oil Front Month up to 67.9800

March 9, 2021 11:17 am | By Autochartist

Rising Wedge identified at 09-Mar-2021 05:00 EST. This pattern is... Read more →

Feeder Cattle Front Month down to 137.2250

March 9, 2021 11:17 am | By Autochartist

Channel Down identified at 08-Mar-2021 14:00 EST. This pattern is... Read more →

Soybean Oil up to 53.2300

March 9, 2021 11:17 am | By Autochartist

Channel Up identified at 09-Mar-2021 04:30 EST. This pattern is... Read more →

Silver Front Month up to 26.5600

March 9, 2021 11:17 am | By Autochartist

Approaching Resistance level of 26.5600 identified at 09-Mar-2021 04:00 EST Read more →

10 year T-Note up to 133.1644

March 9, 2021 11:17 am | By Autochartist

Falling Wedge has broken through the resistance line at 09-Mar-2021... Read more →

  • About Us
  • Privacy Policy
  • Disclaimer
  • Terms and Conditions
  • Get started for FREE
  • Contact Us
Copyright © 2022 Autochartist.com. All rights reserved.
This site uses cookies: Find out more.