Help & Documentation
  • Home
  • Sign In
  • Contact Us
  • Home
  • Sign In
  • Contact Us

Corn down to 375.2500

/Futures Technical Analysis - TD/Corn down to 375.2500

Corn down to 375.2500

Posted on December 25, 2018 by Autochartist wrote in Futures Technical Analysis - TD.

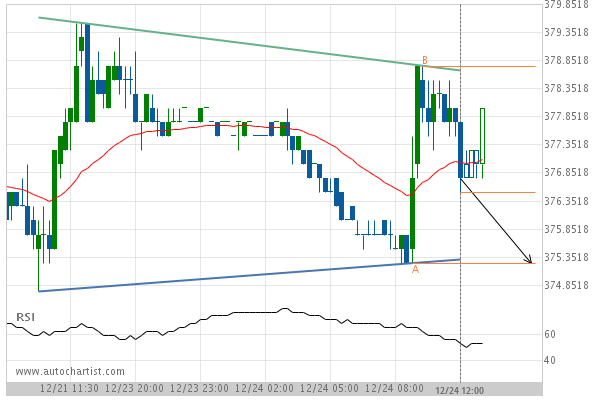
Triangle identified at 24-Dec-2018 12:00 EST. This pattern is still in the process of forming. Possible bearish price movement towards the support 375.2500 within the next 5 hours.

Tags: CBOT, ZC
0 Likes
908 Views

You may also like

Gold Front Month up to 1522.3000
October 11, 2019
Soybeans down to 824.4728
May 22, 2020
Lean Hogs down to 60.8750
September 6, 2019

Comments are closed.

CAD/CHF excessive bearish movement Apple Inc. (AAPL) excessive bearish movement

Futures Technical Analysis – TD

Light Sweet Crude Oil Front Month up to 67.9800

March 9, 2021 11:17 am | By Autochartist

Rising Wedge identified at 09-Mar-2021 05:00 EST. This pattern is... Read more →

Feeder Cattle Front Month down to 137.2250

March 9, 2021 11:17 am | By Autochartist

Channel Down identified at 08-Mar-2021 14:00 EST. This pattern is... Read more →

Soybean Oil up to 53.2300

March 9, 2021 11:17 am | By Autochartist

Channel Up identified at 09-Mar-2021 04:30 EST. This pattern is... Read more →

Silver Front Month up to 26.5600

March 9, 2021 11:17 am | By Autochartist

Approaching Resistance level of 26.5600 identified at 09-Mar-2021 04:00 EST Read more →

10 year T-Note up to 133.1644

March 9, 2021 11:17 am | By Autochartist

Falling Wedge has broken through the resistance line at 09-Mar-2021... Read more →

  • About Us
  • Privacy Policy
  • Disclaimer
  • Terms and Conditions
  • Get started for FREE
  • Contact Us
Copyright © 2022 Autochartist.com. All rights reserved.
This site uses cookies: Find out more.