Help & Documentation
  • Home
  • Sign In
  • Contact Us
  • Home
  • Sign In
  • Contact Us

Corn down to 374.1596

/Futures Technical Analysis - TD/Corn down to 374.1596

Corn down to 374.1596

Posted on December 10, 2019 by Autochartist wrote in Futures Technical Analysis - TD.

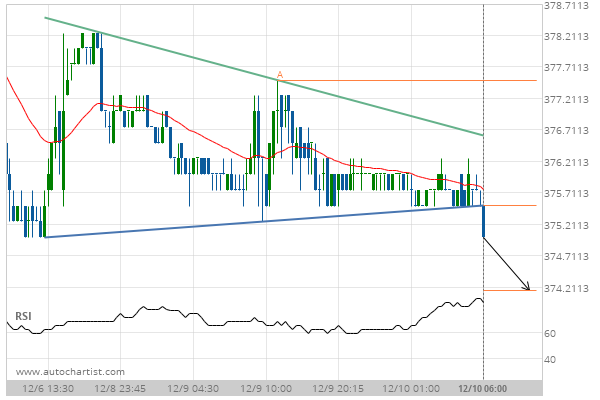
Descending Triangle has broken through the support line at 10-Dec-2019 06:00 EST. Possible bearish price movement forecast for the next 10 hours towards 374.1596.

Tags: CBOT, ZC
0 Likes
681 Views

You may also like

US T-Bond down to 177.3125
June 1, 2020
10 year T-Note up to 129.6406
January 6, 2020
Silver Front Month down to 18.0395
September 2, 2019

Comments are closed.

Gold Front Month up to 1469.8000 US T-Bond up to 158.5313

Futures Technical Analysis – TD

Light Sweet Crude Oil Front Month up to 67.9800

March 9, 2021 11:17 am | By Autochartist

Rising Wedge identified at 09-Mar-2021 05:00 EST. This pattern is... Read more →

Feeder Cattle Front Month down to 137.2250

March 9, 2021 11:17 am | By Autochartist

Channel Down identified at 08-Mar-2021 14:00 EST. This pattern is... Read more →

Soybean Oil up to 53.2300

March 9, 2021 11:17 am | By Autochartist

Channel Up identified at 09-Mar-2021 04:30 EST. This pattern is... Read more →

Silver Front Month up to 26.5600

March 9, 2021 11:17 am | By Autochartist

Approaching Resistance level of 26.5600 identified at 09-Mar-2021 04:00 EST Read more →

10 year T-Note up to 133.1644

March 9, 2021 11:17 am | By Autochartist

Falling Wedge has broken through the resistance line at 09-Mar-2021... Read more →

  • About Us
  • Privacy Policy
  • Disclaimer
  • Terms and Conditions
  • Get started for FREE
  • Contact Us
Copyright © 2022 Autochartist.com. All rights reserved.
This site uses cookies: Find out more.