Help & Documentation
  • Home
  • Sign In
  • Contact Us
  • Home
  • Sign In
  • Contact Us

Corn down to 368.5689

/Futures Technical Analysis - TD/Corn down to 368.5689

Corn down to 368.5689

Posted on September 2, 2019 by Autochartist wrote in Futures Technical Analysis - TD.

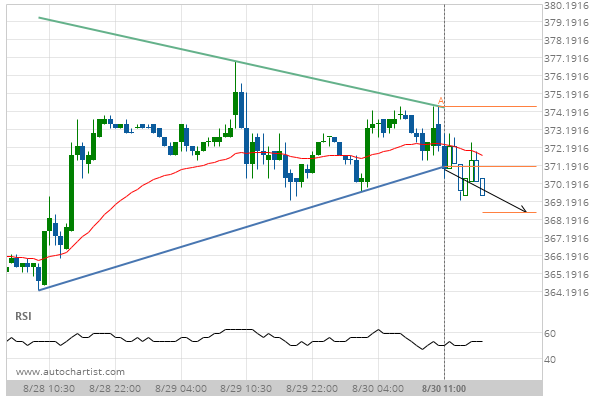
Triangle has broken through the support line at 30-Aug-2019 11:00 EDT. Possible bearish price movement forecast for the next 9 hours towards 368.5689.

Tags: CBOT, ZC
0 Likes
676 Views

You may also like

Gold Front Month up to 1749.2000
June 19, 2020
Corn up to 353.7500
Corn up to 353.7500
July 2, 2020
Light Sweet Crude Oil Front Month down to 46.1600
December 30, 2020

Comments are closed.

Exxon Mobil Corp. – resistance line breached US T-Bond down to 164.4375

Futures Technical Analysis – TD

Light Sweet Crude Oil Front Month up to 67.9800

March 9, 2021 11:17 am | By Autochartist

Rising Wedge identified at 09-Mar-2021 05:00 EST. This pattern is... Read more →

Feeder Cattle Front Month down to 137.2250

March 9, 2021 11:17 am | By Autochartist

Channel Down identified at 08-Mar-2021 14:00 EST. This pattern is... Read more →

Soybean Oil up to 53.2300

March 9, 2021 11:17 am | By Autochartist

Channel Up identified at 09-Mar-2021 04:30 EST. This pattern is... Read more →

Silver Front Month up to 26.5600

March 9, 2021 11:17 am | By Autochartist

Approaching Resistance level of 26.5600 identified at 09-Mar-2021 04:00 EST Read more →

10 year T-Note up to 133.1644

March 9, 2021 11:17 am | By Autochartist

Falling Wedge has broken through the resistance line at 09-Mar-2021... Read more →

  • About Us
  • Privacy Policy
  • Disclaimer
  • Terms and Conditions
  • Get started for FREE
  • Contact Us
Copyright © 2022 Autochartist.com. All rights reserved.
This site uses cookies: Find out more.