Help & Documentation
  • Home
  • Sign In
  • Contact Us
  • Home
  • Sign In
  • Contact Us

CORN DECEMBER 2019 up to 383.7500

/Futures Technical Analysis - TD/CORN DECEMBER 2019 up to 383.7500

CORN DECEMBER 2019 up to 383.7500

Posted on November 20, 2019 by Autochartist wrote in Futures Technical Analysis - TD.

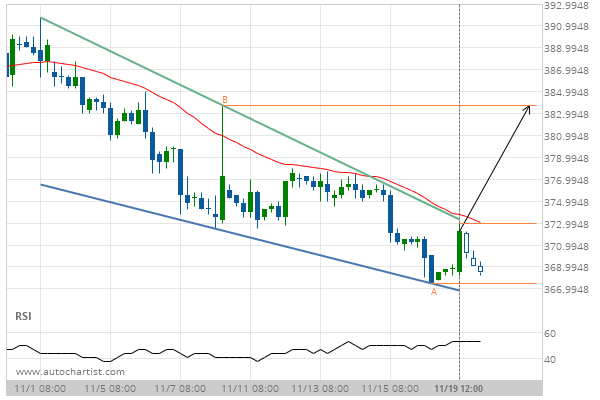
Falling Wedge identified at 19-Nov-2019 12:00 EST. This pattern is still in the process of forming. Possible bullish price movement towards the resistance 383.7500 within the next 3 days.

Tags: CBOT, ZC
0 Likes
593 Views

You may also like

Lean Hogs up to 88.3250
June 5, 2019
Lean Hogs up to 64.8750
January 30, 2019
Soybean Oil up to 26.8400
May 13, 2020

Comments are closed.

10 year T-Note down to 129.1563 Gold Front Month up to 1483.7800

Futures Technical Analysis – TD

Light Sweet Crude Oil Front Month up to 67.9800

March 9, 2021 11:17 am | By Autochartist

Rising Wedge identified at 09-Mar-2021 05:00 EST. This pattern is... Read more →

Feeder Cattle Front Month down to 137.2250

March 9, 2021 11:17 am | By Autochartist

Channel Down identified at 08-Mar-2021 14:00 EST. This pattern is... Read more →

Soybean Oil up to 53.2300

March 9, 2021 11:17 am | By Autochartist

Channel Up identified at 09-Mar-2021 04:30 EST. This pattern is... Read more →

Silver Front Month up to 26.5600

March 9, 2021 11:17 am | By Autochartist

Approaching Resistance level of 26.5600 identified at 09-Mar-2021 04:00 EST Read more →

10 year T-Note up to 133.1644

March 9, 2021 11:17 am | By Autochartist

Falling Wedge has broken through the resistance line at 09-Mar-2021... Read more →

  • About Us
  • Privacy Policy
  • Disclaimer
  • Terms and Conditions
  • Get started for FREE
  • Contact Us
Copyright © 2020 Autochartist.com. All rights reserved.
This site uses cookies: Find out more.