The Commodity Channel Index
When trading, one of the most important pieces of information to have is the ability to identify momentum—when it begins and when it ends. It can help you plan your next trade and to ensure that that trade is successful. It is in the process of charting momentum that the Commodity Channel Index is especially effective, and that is regardless whether you are trading commodities, stocks or forex.
The rationale behind the Commodity Channel Index or CCI is that it is an oscillator that measures the deviation from the simple moving average over the period. Just like most oscillators, it has an overbought level and an oversold.
In theory, using the CCI is similar to reading a Relative Strength Indicator (RSI). If the CCI is relatively high then the pair is overbought and when it is relatively low, the pair is oversold. In practice, however, using the CCI is a bit more complicated than the RSI. Unless the CCI is calibrated correctly it is practically worthless in identifying momentum cycles. Moreover, without correct calibration, it can generate plenty of false signals. But if you calibrated the CCI well it is an extremely efficient and powerful tool.
Calibrating the Commodity Channel Index
The first step in calibrating the CCI is to identify when the current cycle began. This will help us decide the right period in which to run the CCI. In order to identify the beginning of the current cycle we can use Fibonacci Time Zones, which will give us an accurate measure.
For example, when we look at the Fibonacci Time Zones in the weekly chart below, we can conclude that the current cycle started 36 weeks ago. The rule of thumb is to divide the total period by three to give the average a bit more sensitivity. In the example below, it will be 36/3=12 weeks. That is the average the CCI should run on.
The reason we use Fibonacci Time Zones to calibrate the CCI is because the cycle’s length changes from wave to wave as they become longer and consequently the relevant average changes. Through the Fibonacci Time Zones, we can estimate with some degree of confidence when the cycle started.

Analysing the CCI
Once the CCI is calibrated, the rest is simple. The CCI, as previously mentioned, measures overbought and oversold levels. But rather than just looking at relative highs of the index we need to look at its behavior.
For example, in the Gold chart below, we can see that the CCI is converging with the price movement. That is a clear sign that bullish momentum is fading. If we take it a step further and continue our trend line all the way to the bottom, we can conclude another thing; that is that the pair, in this case XAU/USD, has already peaked and is heading lower in a bearish momentum.
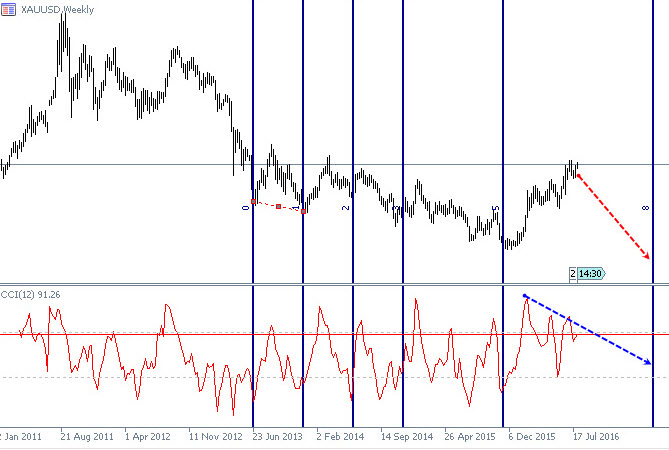
Another way to chart the momentum is by examining the CCI behavior between the Fibonacci Time Zones. Notice that the CCI has a tendency to bottom out when the cycle ends and then rise. We can use that to ride on a rebound. There are cases, especially on a long term bullish trend, that we can get the exact opposite effect, i.e., the CCI peaks every time a Fibonacci Time Zone ends. The idea is to observe the pattern and then use it to your advantage.
Of course, as I’ve said in the past, oscillators should always be used alongside other indicators to get the full picture, and the Commodity Price Channel is no different. As usual in trading, there are no guarantees, but certainly the well calibrated CCI can provide a very coherent picture of where a pair’s momentum is headed, north or south.