Help & Documentation
  • Home
  • Sign In
  • Contact Us
  • Home
  • Sign In
  • Contact Us

Chevron (CVX) up to 91.29

/US Stocks Technical Analysis - TD/Chevron (CVX) up to 91.29

Chevron (CVX) up to 91.29

Posted on August 11, 2020 by Autochartist wrote in US Stocks Technical Analysis - TD.

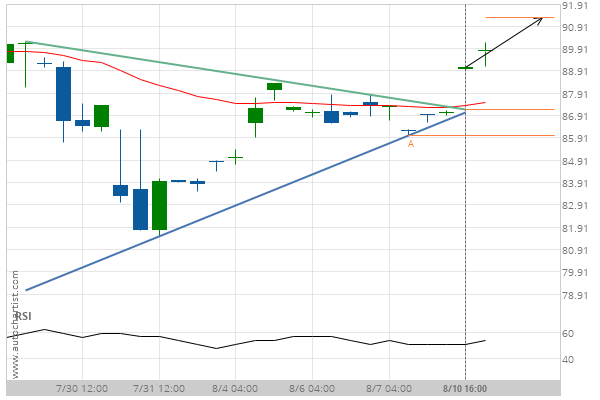
Triangle has broken through the resistance line at 10-Aug-2020 16:00 EDT. Possible bullish price movement forecast for the next 23 hours towards 91.29.

Tags: Chevron, CVX, NYSE
0 Likes
414 Views

You may also like

Caterpillar Inc. (CAT) up to 125.19
June 4, 2020
Merck & Co. Inc. (MRK) down to 81.71
February 24, 2020
Home Depot Inc. (HD) up to 252.50
July 13, 2020

Comments are closed.

Jpmorgan Chase & Co. (JPM) down to 95.87 Intel Corporation () up to 49.74

US Stocks Technical Analysis – TD

Merck & Co. Inc. (MRK) up to 75.56

March 9, 2021 11:13 am | By Autochartist

Rising Wedge identified at 08-Mar-2021 19:30 EST. This pattern is... Read more →

Jpmorgan Chase & Co. (JPM) down to 147.97

March 9, 2021 11:13 am | By Autochartist

Channel Up identified at 08-Mar-2021 19:00 EST. This pattern is... Read more →

Visa (V) down to 215.41

March 9, 2021 11:13 am | By Autochartist

Triangle identified at 08-Mar-2021 20:00 EST. This pattern is still... Read more →

Home Depot Inc. (HD) down to 247.10

March 9, 2021 11:13 am | By Autochartist

Channel Down identified at 08-Mar-2021 16:00 EST. This pattern is... Read more →

Intel Corporation () down to 58.10

March 9, 2021 11:13 am | By Autochartist

Approaching Support level of 58.10 identified at 08-Mar-2021 16:00 EST Read more →

  • About Us
  • Privacy Policy
  • Disclaimer
  • Terms and Conditions
  • Get started for FREE
  • Contact Us
Copyright © 2022 Autochartist.com. All rights reserved.
This site uses cookies: Find out more.