Help & Documentation
  • Home
  • Sign In
  • Contact Us
  • Home
  • Sign In
  • Contact Us

Chevron (CVX) up to 121.95

/US Stocks Technical Analysis - TD/Chevron (CVX) up to 121.95

Chevron (CVX) up to 121.95

Posted on May 2, 2019 by Autochartist wrote in US Stocks Technical Analysis - TD.

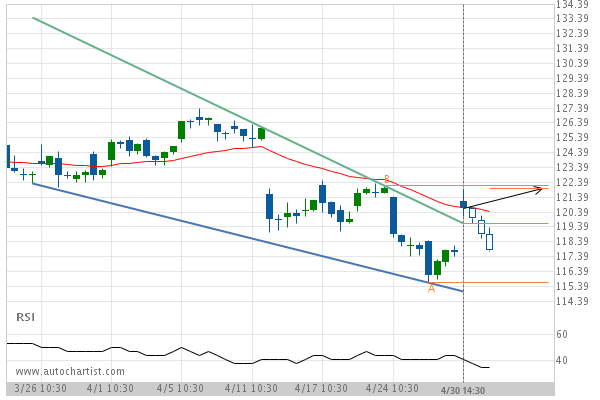
Falling Wedge has broken through the resistance line at 30-Apr-2019 14:30 EDT. Possible bullish price movement forecast for the next day towards 121.95.

Tags: Chevron, CVX, NYSE
0 Likes
857 Views

You may also like

Verizon Communications Inc. (VZ) up to 57.08
February 8, 2021
Wal-Mart Stores (WMT) down to 102.83
April 26, 2019
Visa (V) down to 166.98
August 15, 2019

Comments are closed.

Verizon Communications Inc. (VZ) down to 55.75 DowDuPont (DWDP) down to 36.29

US Stocks Technical Analysis – TD

Merck & Co. Inc. (MRK) up to 75.56

March 9, 2021 11:13 am | By Autochartist

Rising Wedge identified at 08-Mar-2021 19:30 EST. This pattern is... Read more →

Jpmorgan Chase & Co. (JPM) down to 147.97

March 9, 2021 11:13 am | By Autochartist

Channel Up identified at 08-Mar-2021 19:00 EST. This pattern is... Read more →

Visa (V) down to 215.41

March 9, 2021 11:13 am | By Autochartist

Triangle identified at 08-Mar-2021 20:00 EST. This pattern is still... Read more →

Home Depot Inc. (HD) down to 247.10

March 9, 2021 11:13 am | By Autochartist

Channel Down identified at 08-Mar-2021 16:00 EST. This pattern is... Read more →

Intel Corporation () down to 58.10

March 9, 2021 11:13 am | By Autochartist

Approaching Support level of 58.10 identified at 08-Mar-2021 16:00 EST Read more →

  • About Us
  • Privacy Policy
  • Disclaimer
  • Terms and Conditions
  • Get started for FREE
  • Contact Us
Copyright © 2022 Autochartist.com. All rights reserved.
This site uses cookies: Find out more.