Help & Documentation
  • Home
  • Sign In
  • Contact Us
  • Home
  • Sign In
  • Contact Us

Chevron (CVX) up to 119.56

/US Stocks Technical Analysis - TD/Chevron (CVX) up to 119.56

Chevron (CVX) up to 119.56

Posted on January 21, 2019 by Autochartist wrote in US Stocks Technical Analysis - TD.

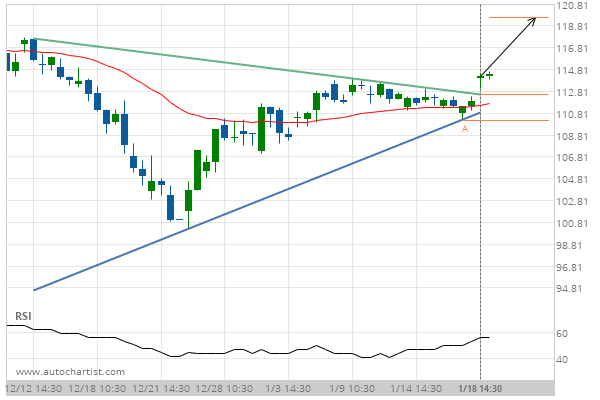
Triangle has broken through the resistance line at 18-Jan-2019 14:30 EST. Possible bullish price movement forecast for the next 3 days towards 119.56.

Tags: Chevron, CVX, NYSE
0 Likes
804 Views

You may also like

Wal-Mart Stores (WMT) up to 146.29
February 16, 2021
DowDuPont (DWDP) down to 30.12
June 3, 2019
Wal-Mart Stores (WMT) up to 147.90
January 11, 2021

Comments are closed.

Cisco Systems Inc. (CSCO) down to 43.85 Home Depot Inc. (HD) up to 181.27

US Stocks Technical Analysis – TD

Merck & Co. Inc. (MRK) up to 75.56

March 9, 2021 11:13 am | By Autochartist

Rising Wedge identified at 08-Mar-2021 19:30 EST. This pattern is... Read more →

Jpmorgan Chase & Co. (JPM) down to 147.97

March 9, 2021 11:13 am | By Autochartist

Channel Up identified at 08-Mar-2021 19:00 EST. This pattern is... Read more →

Visa (V) down to 215.41

March 9, 2021 11:13 am | By Autochartist

Triangle identified at 08-Mar-2021 20:00 EST. This pattern is still... Read more →

Home Depot Inc. (HD) down to 247.10

March 9, 2021 11:13 am | By Autochartist

Channel Down identified at 08-Mar-2021 16:00 EST. This pattern is... Read more →

Intel Corporation () down to 58.10

March 9, 2021 11:13 am | By Autochartist

Approaching Support level of 58.10 identified at 08-Mar-2021 16:00 EST Read more →

  • About Us
  • Privacy Policy
  • Disclaimer
  • Terms and Conditions
  • Get started for FREE
  • Contact Us
Copyright © 2020 Autochartist.com. All rights reserved.
This site uses cookies: Find out more.