Help & Documentation
  • Home
  • Sign In
  • Contact Us
  • Home
  • Sign In
  • Contact Us

Chevron (CVX) down to 123.03

/US Stocks Technical Analysis - TD/Chevron (CVX) down to 123.03

Chevron (CVX) down to 123.03

Posted on June 27, 2019 by Autochartist wrote in US Stocks Technical Analysis - TD.

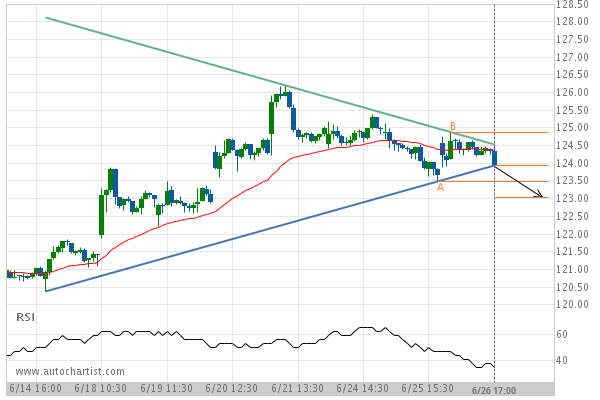
Triangle has broken through the support line at 26-Jun-2019 17:00 EDT. Possible bearish price movement forecast for the next 17 hours towards 123.03.

Tags: Chevron, CVX, NYSE
0 Likes
908 Views

You may also like

3m Co. (MMM) up to 122.55
March 24, 2020
Wal-Mart Stores () down to 146.57
December 7, 2020
Visa (V) down to 132.26
October 25, 2018

Comments are closed.

Either a rebound or a breakout imminent on Microsoft Corporation Home Depot Inc. (HD) up to 210.17

US Stocks Technical Analysis – TD

Merck & Co. Inc. (MRK) up to 75.56

March 9, 2021 11:13 am | By Autochartist

Rising Wedge identified at 08-Mar-2021 19:30 EST. This pattern is... Read more →

Jpmorgan Chase & Co. (JPM) down to 147.97

March 9, 2021 11:13 am | By Autochartist

Channel Up identified at 08-Mar-2021 19:00 EST. This pattern is... Read more →

Visa (V) down to 215.41

March 9, 2021 11:13 am | By Autochartist

Triangle identified at 08-Mar-2021 20:00 EST. This pattern is still... Read more →

Home Depot Inc. (HD) down to 247.10

March 9, 2021 11:13 am | By Autochartist

Channel Down identified at 08-Mar-2021 16:00 EST. This pattern is... Read more →

Intel Corporation () down to 58.10

March 9, 2021 11:13 am | By Autochartist

Approaching Support level of 58.10 identified at 08-Mar-2021 16:00 EST Read more →

  • About Us
  • Privacy Policy
  • Disclaimer
  • Terms and Conditions
  • Get started for FREE
  • Contact Us
Copyright © 2022 Autochartist.com. All rights reserved.
This site uses cookies: Find out more.