Help & Documentation
  • Home
  • Sign In
  • Contact Us
  • Home
  • Sign In
  • Contact Us

Chevron (CVX) down to 117.94

/US Stocks Technical Analysis - TD/Chevron (CVX) down to 117.94

Chevron (CVX) down to 117.94

Posted on November 25, 2019 by Autochartist wrote in US Stocks Technical Analysis - TD.

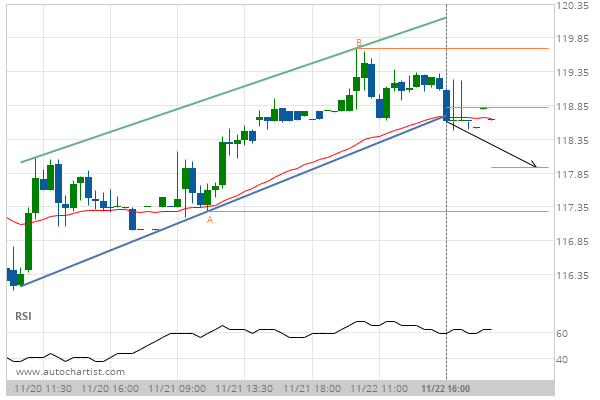
Channel Up has broken through the support line at 22-Nov-2019 16:00 EST. Possible bearish price movement forecast for the next 6 hours towards 117.94.

Tags: Chevron, CVX, NYSE
0 Likes
708 Views

You may also like

Merck & Co. Inc. (MRK) down to 66.75
March 26, 2020
3m Co. (MMM) up to 150.64
April 20, 2020
Intel Corporation () down to 57.49
December 2, 2019

Comments are closed.

Silver Front Month excessive bearish movement Exxon Mobil Corp. (XOM) down to 67.32

US Stocks Technical Analysis – TD

Merck & Co. Inc. (MRK) up to 75.56

March 9, 2021 11:13 am | By Autochartist

Rising Wedge identified at 08-Mar-2021 19:30 EST. This pattern is... Read more →

Jpmorgan Chase & Co. (JPM) down to 147.97

March 9, 2021 11:13 am | By Autochartist

Channel Up identified at 08-Mar-2021 19:00 EST. This pattern is... Read more →

Visa (V) down to 215.41

March 9, 2021 11:13 am | By Autochartist

Triangle identified at 08-Mar-2021 20:00 EST. This pattern is still... Read more →

Home Depot Inc. (HD) down to 247.10

March 9, 2021 11:13 am | By Autochartist

Channel Down identified at 08-Mar-2021 16:00 EST. This pattern is... Read more →

Intel Corporation () down to 58.10

March 9, 2021 11:13 am | By Autochartist

Approaching Support level of 58.10 identified at 08-Mar-2021 16:00 EST Read more →

  • About Us
  • Privacy Policy
  • Disclaimer
  • Terms and Conditions
  • Get started for FREE
  • Contact Us
Copyright © 2020 Autochartist.com. All rights reserved.
This site uses cookies: Find out more.