Help & Documentation
  • Home
  • Sign In
  • Contact Us
  • Home
  • Sign In
  • Contact Us

CAD/CHF up to 0.6862

/Forex Technical Analysis - TD/CAD/CHF up to 0.6862

CAD/CHF up to 0.6862

Posted on April 22, 2020 by Autochartist wrote in Forex Technical Analysis - TD.

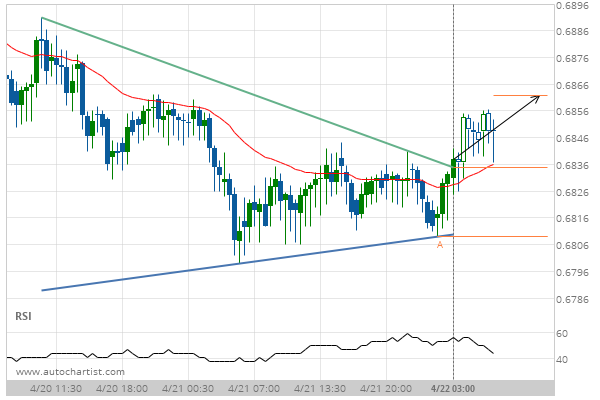
Triangle has broken through the resistance line at 22-Apr-2020 03:00 EDT. Possible bullish price movement forecast for the next 13 hours towards 0.6862.

Tags: CADCHF
0 Likes
514 Views

You may also like

NZD/USD up to 0.6699
October 1, 2018
GBP/JPY up to 133.7894
April 30, 2020
GBP/USD up to 1.2191
August 16, 2019

Comments are closed.

EUR/NZD up to 1.8294 GBP/NZD down to 2.0468

Forex Technical Analysis – TD

EUR/CHF up to 1.1152

March 9, 2021 11:15 am | By Autochartist

Rising Wedge identified at 09-Mar-2021 00:00 EST. This pattern is... Read more →

EUR/JPY up to 129.6360

March 9, 2021 11:15 am | By Autochartist

Triangle identified at 08-Mar-2021 20:00 EST. This pattern is still... Read more →

NZD/USD up to 0.7188

March 9, 2021 11:15 am | By Autochartist

Broke through Resistance level of 0.7153 at 09-Mar-2021 04:00 EST Read more →

USD/JPY down to 108.1606

March 9, 2021 11:15 am | By Autochartist

Rising Wedge has broken through the support line at 09-Mar-2021... Read more →

USD/CHF down to 0.9284

March 9, 2021 11:15 am | By Autochartist

Approaching Support level of 0.9284 identified at 09-Mar-2021 05:15 EST Read more →

  • About Us
  • Privacy Policy
  • Disclaimer
  • Terms and Conditions
  • Get started for FREE
  • Contact Us
Copyright © 2022 Autochartist.com. All rights reserved.
This site uses cookies: Find out more.