Help & Documentation
  • Home
  • Sign In
  • Contact Us
  • Home
  • Sign In
  • Contact Us

3m Co. (MMM) up to 209.75

/US Stocks Technical Analysis - TD/3m Co. (MMM) up to 209.75

3m Co. (MMM) up to 209.75

Posted on November 16, 2018 by Autochartist wrote in US Stocks Technical Analysis - TD.

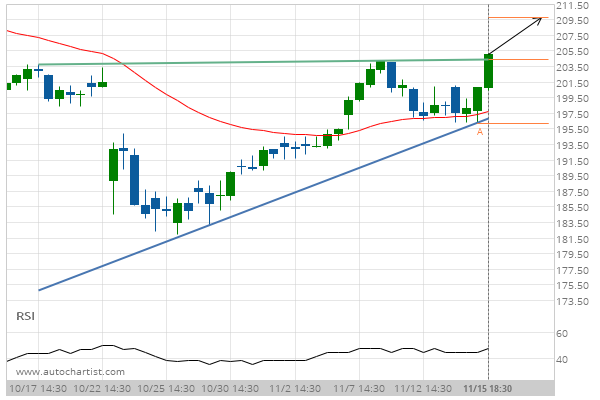
Ascending Triangle has broken through the resistance line at 15-Nov-2018 18:30 EST. Possible bullish price movement forecast for the next 3 days towards 209.75.

Tags: 3m Co., MMM, NYSE
0 Likes
1286 Views

You may also like

General Electric Co. (GE) up to 7.29
April 3, 2020
3m Co. () up to 151.50
April 7, 2020
3m Co. (MMM) up to 219.33
April 19, 2019

Comments are closed.

General Electric Co. (GE) down to 7.72 GBP/CHF up to 1.2951

US Stocks Technical Analysis – TD

Merck & Co. Inc. (MRK) up to 75.56

March 9, 2021 11:13 am | By Autochartist

Rising Wedge identified at 08-Mar-2021 19:30 EST. This pattern is... Read more →

Jpmorgan Chase & Co. (JPM) down to 147.97

March 9, 2021 11:13 am | By Autochartist

Channel Up identified at 08-Mar-2021 19:00 EST. This pattern is... Read more →

Visa (V) down to 215.41

March 9, 2021 11:13 am | By Autochartist

Triangle identified at 08-Mar-2021 20:00 EST. This pattern is still... Read more →

Home Depot Inc. (HD) down to 247.10

March 9, 2021 11:13 am | By Autochartist

Channel Down identified at 08-Mar-2021 16:00 EST. This pattern is... Read more →

Intel Corporation () down to 58.10

March 9, 2021 11:13 am | By Autochartist

Approaching Support level of 58.10 identified at 08-Mar-2021 16:00 EST Read more →

  • About Us
  • Privacy Policy
  • Disclaimer
  • Terms and Conditions
  • Get started for FREE
  • Contact Us
Copyright © 2022 Autochartist.com. All rights reserved.
This site uses cookies: Find out more.