3 Candlesticks Every Trader Should Know
Understanding the various types of candlesticks is one of the first things every novice trader should learn. But the experienced trader should also never forget the candlesticks’ significance. Because sometimes, when you have to figure out what’s about to happen with a certain pair and all other indicators fail, it’s the basics of reading candlesticks that can save the day—just like a sailor who navigates using the North Star when all else fails.
But even when you’re not in the unknown, reading candlestick shapes well lets you figure out the immediate trend quickly and can save time in the long run. So, regardless of your level of trading experience, here are three candlesticks every trader should know.
Hammer Candlestick
A hammer candlestick, as its name suggests, has a hammer-like form, with the opening and closing price rather close, and the lower shade (or upper shade if it’s a reverse hammer candlestick) substantially long.
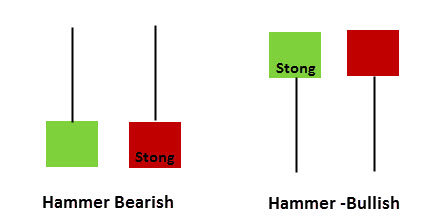
What a hammer signals is a change of momentum. If we examine the bullish hammer, we can see the candlestick’s closing price substantially lower than the highest point. That suggests that selling pressure has been so strong that it pushed for a close that is way below the high; in other words, the sellers have the upper hand. And vice versa for a bullish hammer where the momentum is set to turn bullish from bearish.
Note that each hammer type has a stronger version which suggests the change in momentum will be stronger. If we’re on a bullish trend and the next candlestick is a hammer, where the closing price is not only much lower than the highest price for the candlestick but lower than the opening, then it suggests a much stronger change in momentum.
Nevertheless, the greatest determinant in assessing the strength of the rebound to follow is the shade. The longer the shade of the candlestick compared to the rest of the candlestick, the stronger the change in momentum expected.
But on the flipside, beware if the shade is relatively short; the change in momentum might be unreliable,
Doji Candlestick
A Doji candlestick is a candlestick where the opening price and the closing price are so close they almost align. There are several variations of the Doji candlestick, but these three are the most noteworthy.
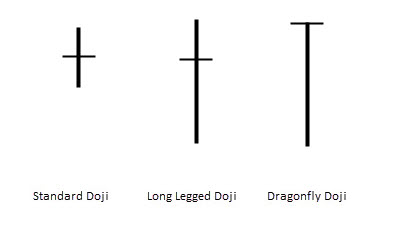
The Standard Doji – The standard Doji candlestick is similar to the general description above, with the opening and closing price aligned (or almost aligned) and the two shades sticking out. What a standard Doji implies is a stalemate between the buyers and the sellers at the opening/closing price. When it comes after a certain trend, down or up, it suggests a pause, and could imply either a resumption of the trend or a change in trend. But that’s not all. Compared to the other two, the standard Doji has a relatively short shade on both sides and that suggests a weaker momentum.
Long Legged Doji – This is perhaps the most interesting Doji candlestick. Just like the standard Doji, the opening and closing price align almost perfectly. But unlike the standard Doji, the shades on both sides are much longer. What it means is that, just like the standard Doji, there is a stalemate between the sellers and the buyers at the opening/closing price. However, unlike the standard Doji, the long shades imply high volatility around the stalemate area. This means that once the stalemate is broken, we can expect a burst of momentum because volatility is high.
Dragonfly Doji – The somewhat exotic name for this candlestick type is a bit misleading. With a long low shadow, the Dragonfly tends to have the same meaning as the aforementioned Long Legged Doji, albeit with a weaker momentum. Because, otherwise, it would be a hammer with a closing price higher than the opening price. (The Gravestone Doji is a reversed Dragonfly Doji, with the same meaning as a bearish hammer and hence only worth this brief mention.)
Engulfing Candlestick
The engulfing candlestick truly lives up to its name. The candlestick can exist in two forms—a bullish engulfing candlestick and a bearish engulfing candlestick.
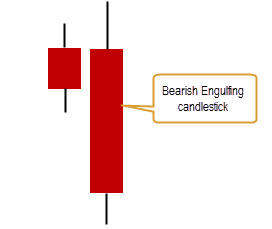
The engulfing candlestick’s clearest distinction is that it engulfs in size the aforementioned candlesticks.
A bullish candlestick will have either a lower opening price than the closing of the previous candlestick or the same price as the previous candlestick closing price but a lower low. But more importantly, the closing price of the bullish engulfing candle is a much higher high. The bearish engulfing candlestick, as illustrated below, is the exact mirror of the bullish engulfing candlestick.
What does an engulfing candlestick signal? A start of a strong trend. Bearish or bullish, when you encounter an engulfing candlestick you should expect a strong move which can be beneficial for momentum traders seeking to ride a strong trend but an engulfing candlestick can also be risky for those who have a position in the opposite direction.
In Conclusion
Obviously, understanding the various candlestick types cannot and should not replace the technical indicators. But recognizing the candlestick types does allow you to quickly figure out what’s coming next, even when in uncharted territory. When the picture cannot be completed by technical indicators, knowing the candlesticks to watch could be your guiding star.