Help & Documentation
  • Home
  • Sign In
  • Contact Us
  • Home
  • Sign In
  • Contact Us

10 year T-Note up to 124.3880

/Futures Technical Analysis - TD/10 year T-Note up to 124.3880

10 year T-Note up to 124.3880

Posted on May 8, 2019 by Autochartist wrote in Futures Technical Analysis - TD.

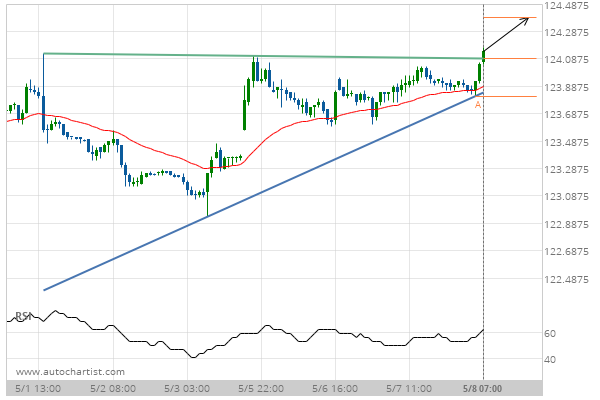
Ascending Triangle has broken through the resistance line at 08-May-2019 07:00 EDT. Possible bullish price movement forecast for the next day towards 124.3880.

Tags: CBOT, ZN
0 Likes
783 Views

You may also like

Soybean Oil down to 27.5505
June 17, 2020
Gold Front Month down to 1307.3000
March 28, 2019
Soybean Oil down to 31.3400
December 11, 2019

Comments are closed.

Silver Front Month up to 15.0371 CORN JULY 2019 up to 371.7500

Futures Technical Analysis – TD

Light Sweet Crude Oil Front Month up to 67.9800

March 9, 2021 11:17 am | By Autochartist

Rising Wedge identified at 09-Mar-2021 05:00 EST. This pattern is... Read more →

Feeder Cattle Front Month down to 137.2250

March 9, 2021 11:17 am | By Autochartist

Channel Down identified at 08-Mar-2021 14:00 EST. This pattern is... Read more →

Soybean Oil up to 53.2300

March 9, 2021 11:17 am | By Autochartist

Channel Up identified at 09-Mar-2021 04:30 EST. This pattern is... Read more →

Silver Front Month up to 26.5600

March 9, 2021 11:17 am | By Autochartist

Approaching Resistance level of 26.5600 identified at 09-Mar-2021 04:00 EST Read more →

10 year T-Note up to 133.1644

March 9, 2021 11:17 am | By Autochartist

Falling Wedge has broken through the resistance line at 09-Mar-2021... Read more →

  • About Us
  • Privacy Policy
  • Disclaimer
  • Terms and Conditions
  • Get started for FREE
  • Contact Us
Copyright © 2022 Autochartist.com. All rights reserved.
This site uses cookies: Find out more.