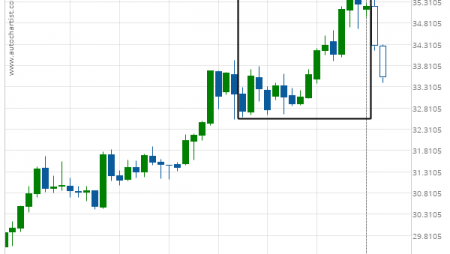
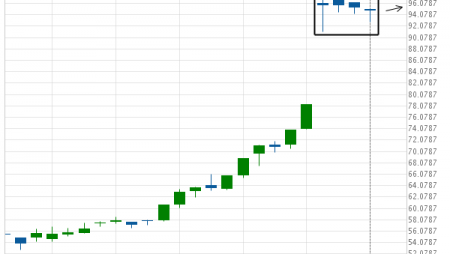
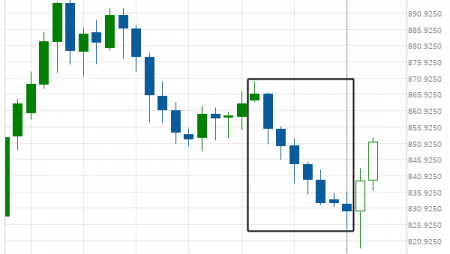
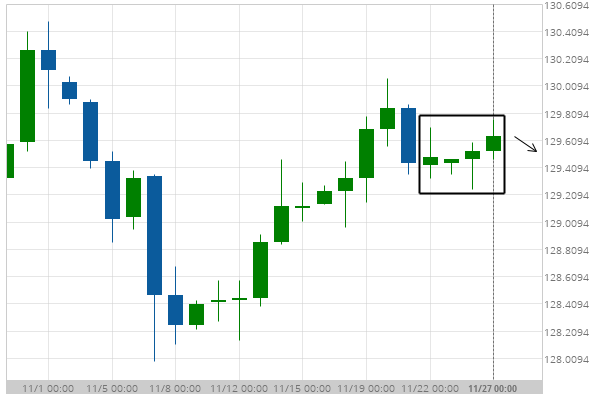
10 year T-Note excessive bullish movement
10 year T-Note experienced 4 consecutive bullish candles. Possible bearish price movement to follow.
10 year T-Note experienced 4 consecutive bullish candles. Possible bearish price movement to follow.