Help & Documentation
  • Home
  • Sign In
  • Contact Us
  • Home
  • Sign In
  • Contact Us

10 year T-Note excessive bearish movement

/Futures Statistical Analysis - TD/10 year T-Note excessive bearish movement

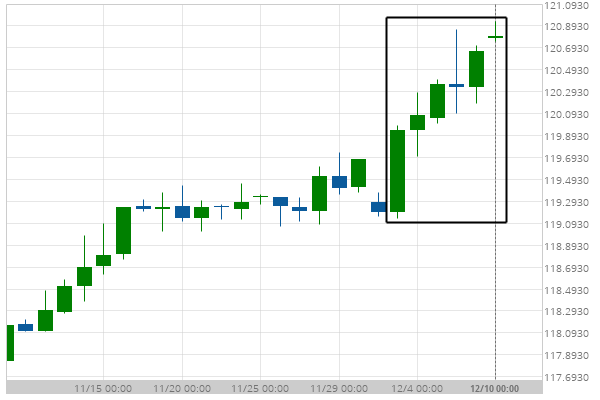
10 year T-Note excessive bearish movement

Posted on December 10, 2018 by Autochartist wrote in Futures Statistical Analysis - TD.

10 year T-Note experienced a 1.35% bullish movement in the last 7 days.

Tags: Big Movement, ZN
0 Likes
823 Views

You may also like

Soybean Meal excessive bearish movement
July 1, 2020
Soybean Meal excessive bearish movement
April 20, 2020
Corn excessive bearish movement
January 11, 2021

Comments are closed.

AUD/USD Target Level: 0.7176 Visa (V) down to 133.48

Futures Statistical Analysis – TD

Soybean Oil excessive bearish movement

March 9, 2021 11:16 am | By Autochartist

Soybean Oil experienced a 19.04% bullish movement in the last... Read more →

Corn excessive bearish movement

March 8, 2021 11:19 am | By Autochartist

Corn experienced a 4.61% bullish movement in the last 73... Read more →

Gold Front Month excessive bearish movement

March 8, 2021 11:19 am | By Autochartist

Gold Front Month experienced a 6.29% bearish movement in the... Read more →

Light Sweet Crude Oil Front Month excessive bearish movement

March 8, 2021 11:19 am | By Autochartist

Light Sweet Crude Oil Front Month experienced a 8.6% bullish... Read more →

10 year T-Note excessive bearish movement

March 8, 2021 11:19 am | By Autochartist

10 year T-Note experienced a 3.4% bearish movement in the... Read more →

  • About Us
  • Privacy Policy
  • Disclaimer
  • Terms and Conditions
  • Get started for FREE
  • Contact Us
Copyright © 2020 Autochartist.com. All rights reserved.
This site uses cookies: Find out more.