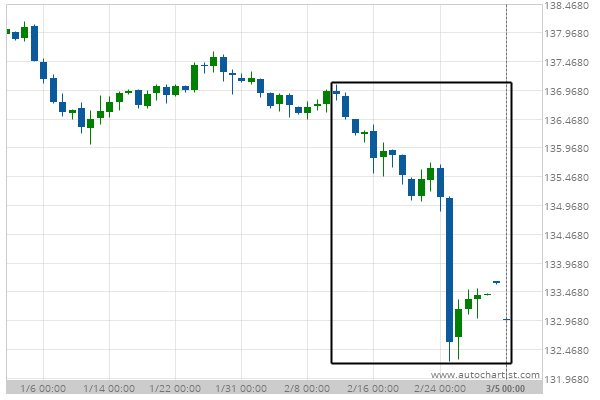
10 year T-Note excessive bearish movement Posted on March 4, 2021 by Autochartist wrote in Futures Statistical Analysis - TD. 10 year T-Note experienced a 2.86% bearish movement in the last 22 days. Tags: Big Movement, ZN 0 Likes 618 Views You may also like Soybean Oil excessive bearish movement August 15, 2019 Corn excessive bearish movement April 8, 2019 Soybean Oil excessive bearish movement September 25, 2018 Comments are closed.