Help & Documentation
  • Home
  • Sign In
  • Contact Us
  • Home
  • Sign In
  • Contact Us

10 year T-Note down to 138.5290

/Futures Technical Analysis - TD/10 year T-Note down to 138.5290

10 year T-Note down to 138.5290

Posted on November 6, 2020 by Autochartist wrote in Futures Technical Analysis - TD.

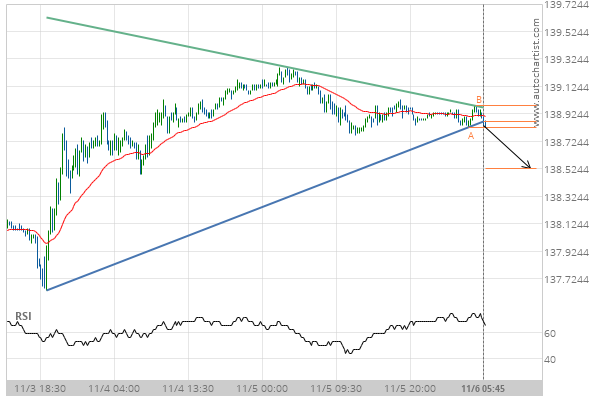
Triangle has broken through the support line at 06-Nov-2020 05:45 EST. Possible bearish price movement forecast for the next 19 hours towards 138.5290.

Tags: CBOT-GBX, ZN
0 Likes
287 Views

You may also like

E-mini S&P 500 up to 2983.1105
October 11, 2019
Silver Front Month up to 27.7400
February 15, 2021
E-mini S&P 500 up to 3014.2500
October 22, 2019

Comments are closed.

Chevron () down to 71.26 Feeder Cattle Front Month down to 132.4750

Futures Technical Analysis – TD

Light Sweet Crude Oil Front Month up to 67.9800

March 9, 2021 11:17 am | By Autochartist

Rising Wedge identified at 09-Mar-2021 05:00 EST. This pattern is... Read more →

Feeder Cattle Front Month down to 137.2250

March 9, 2021 11:17 am | By Autochartist

Channel Down identified at 08-Mar-2021 14:00 EST. This pattern is... Read more →

Soybean Oil up to 53.2300

March 9, 2021 11:17 am | By Autochartist

Channel Up identified at 09-Mar-2021 04:30 EST. This pattern is... Read more →

Silver Front Month up to 26.5600

March 9, 2021 11:17 am | By Autochartist

Approaching Resistance level of 26.5600 identified at 09-Mar-2021 04:00 EST Read more →

10 year T-Note up to 133.1644

March 9, 2021 11:17 am | By Autochartist

Falling Wedge has broken through the resistance line at 09-Mar-2021... Read more →

  • About Us
  • Privacy Policy
  • Disclaimer
  • Terms and Conditions
  • Get started for FREE
  • Contact Us
Copyright © 2020 Autochartist.com. All rights reserved.
This site uses cookies: Find out more.