Help & Documentation
  • Home
  • Sign In
  • Contact Us
  • Home
  • Sign In
  • Contact Us

10 year T-Note down to 124.0313

/Futures Technical Analysis - TD/10 year T-Note down to 124.0313

10 year T-Note down to 124.0313

Posted on May 22, 2019 by admin wrote in Futures Technical Analysis - TD.

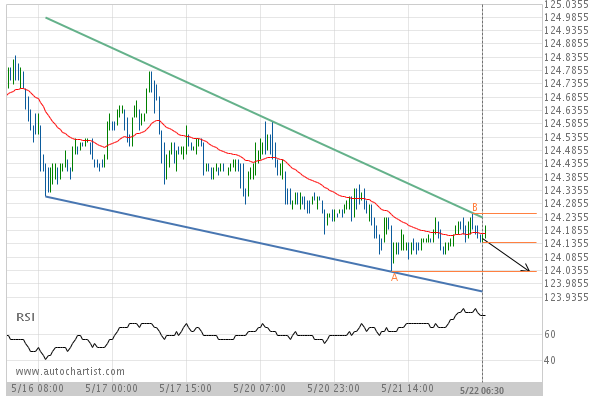
Falling Wedge identified at 22-May-2019 06:30 EDT. This pattern is still in the process of forming. Possible bearish price movement towards the support 124.0313 within the next day.

Tags: CBOT, ZN
0 Likes
3780 Views

You may also like

Silver Front Month down to 18.2350
July 10, 2020
US T-Bond up to 163.3750
January 31, 2020
Corn up to 329.5000
Corn up to 329.5000
July 27, 2020

Comments are closed.

Breach of resistance line imminent by 3m Co. KC HRW Wheat down to 401.0000

Futures Technical Analysis – TD

KC HRW Wheat down to 647.5000

January 19, 2021 11:18 am | By admin

Triangle identified at 19-Jan-2021 06:00 EST. This pattern is still... Read more →

Silver Front Month up to 26.5142

January 19, 2021 11:18 am | By admin

Falling Wedge has broken through the resistance line at 19-Jan-2021... Read more →

Soybean Oil down to 40.6280

January 19, 2021 11:18 am | By admin

Broke through Support level of 41.4800 at 19-Jan-2021 05:00 EST Read more →

Light Sweet Crude Oil Front Month up to 53.1200

January 19, 2021 11:18 am | By admin

Approaching Resistance level of 53.1200 identified at 19-Jan-2021 03:00 EST Read more →

10 year T-Note down to 136.4531

January 19, 2021 11:18 am | By admin

Approaching Support level of 136.4531 identified at 19-Jan-2021 00:00 EST Read more →

  • About Us
  • Privacy Policy
  • Disclaimer
  • Terms and Conditions
  • Get started for FREE
  • Contact Us
Copyright © 2020 Autochartist.com. All rights reserved.
This site uses cookies: Find out more.